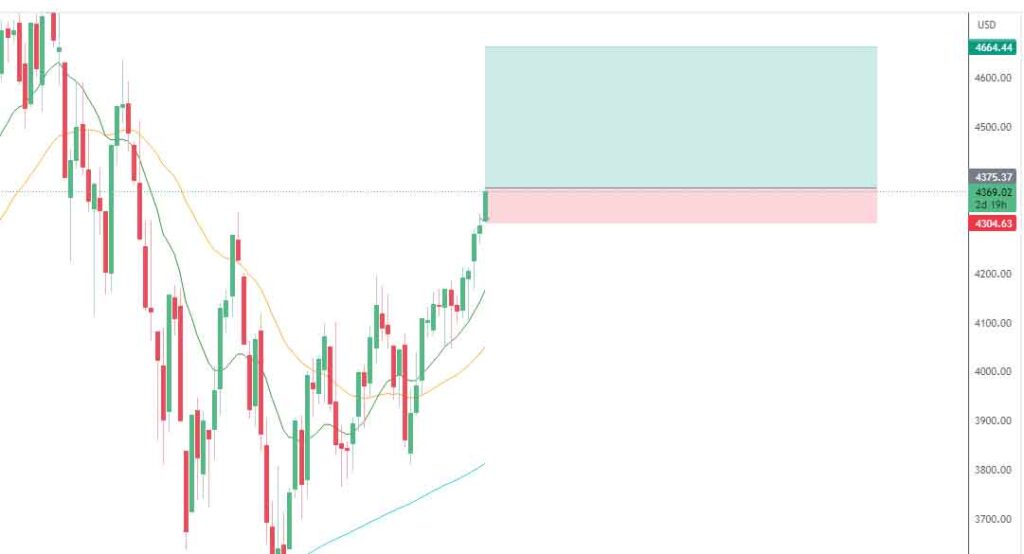
Resistance at 4300: Forex Signal Trade
Resistance levels act as psychological and technical barriers to upward price movements. In this case, the SP500 index forex signal trade has encountered resistance at the level of 4300, indicating that market participants have been actively selling the index around this price level. This suggests that there may be a higher supply of sellers than buyers at this point, potentially leading to a pause or reversal in the current upward trend.
Traders should closely monitor the price action around this resistance level. If the index fails to break convincingly above 4300, it could signal a potential reversal or consolidation in the market. Traders should look for signs of weakness, such as bearish candlestick patterns (e.g., shooting star, bearish engulfing), decreasing buying volume, or negative divergence in technical indicators (e.g., bearish divergence in RSI), to validate the resistance level and assess the potential market direction.

Downward Target Price of 4183:
After encountering resistance, the SP500 index is expected to undergo a downward correction with a target price of 4183. This target price represents a potential support level where buyers may step in and create demand for the index, leading to a potential price recovery or continuation of the overall trend.
Support levels act as areas where buying interest typically outweighs selling pressure, providing a floor for price movements. Traders should closely monitor the price action around the target price of 4183 for signs of a potential reversal or bounce. Bullish candlestick patterns (e.g., hammer, bullish engulfing), increased buying volume, or positive divergence in technical indicators (e.g., bullish divergence in MACD) could indicate a favorable buying opportunity, suggesting that the market has found support at this level.
Stop Loss (SL) Placement at 4304:
To manage risk effectively, traders should consider placing a stop loss order at 4304. The stop loss order is an instruction to sell the asset if it reaches a specified price level, aiming to limit potential losses.
By placing the stop loss at 4304, traders aim to protect their positions in case the price breaks above the resistance level and reverses direction. The stop loss acts as a risk management tool, helping to minimize potential losses. However, it’s important to note that stop loss orders do not guarantee an exact execution price, particularly in fast-moving markets or during price gaps. Traders should be aware of potential slippage, where the executed price may differ from the stop loss price, and adjust their risk management strategies accordingly.
Traders should also consider the placement of the stop loss relative to the resistance level. Placing the stop loss slightly above the resistance level helps avoid premature triggering of the order due to minor price fluctuations, while still providing protection if the price surpasses the resistance level significantly.
As with any trade analysis, it’s incredibly important to take into account a range of other factors that can influence the market. While analyzing resistance levels and target prices is a good starting point, traders should also consider broader market sentiment, the impact of significant news events, and various technical indicators before making any trading decisions.
Market sentiment refers to the overall mood or attitude of traders and investors towards a particular market or asset. Positive sentiment can fuel buying pressure and push prices higher, while negative sentiment can lead to selling pressure and downward price movements. Keeping an eye on market sentiment can help traders gauge the overall market direction and make more informed decisions.


Thank you for your sharing. I am worried that I lack creative ideas. It is your article that makes me full of hope. Thank you. But, I have a question, can you help me?
Thank you for your sharing. I am worried that I lack creative ideas. It is your article that makes me full of hope. Thank you. But, I have a question, can you help me?