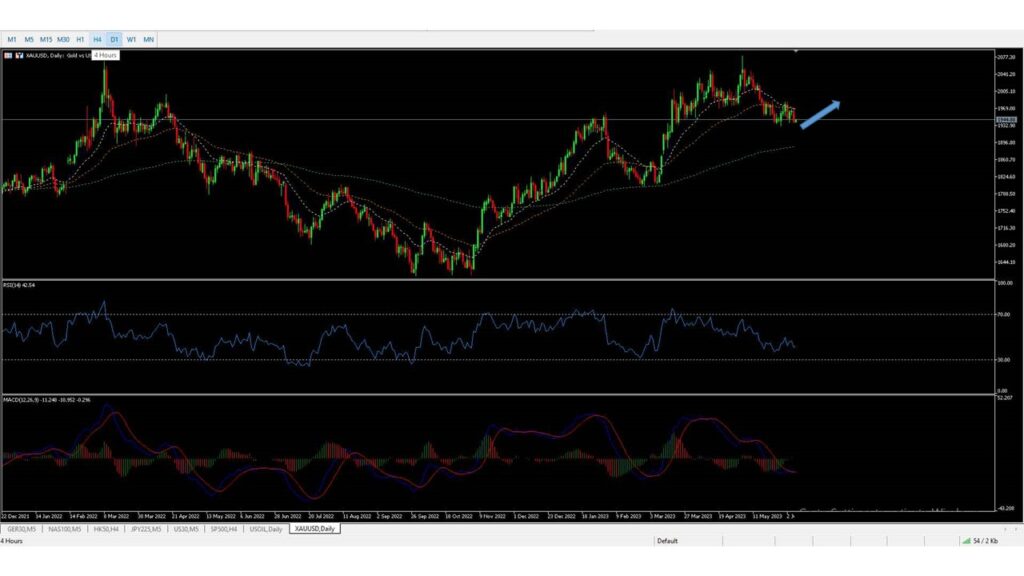
Lately, Gold has received a considerable show of support, finding a strong foothold at the price level of 1936. This discovery of support brings forth a sense of optimism, indicating a potential bullish trade signal. It’s like buyers have stepped onto the scene, acting as guardians, preventing the price of Gold from tumbling further. This shift in market sentiment is seen as a positive development, fueling hopes for an upward movement in Gold’s price. Traders are intrigued by this encouraging behavior from buyers, as it suggests a growing confidence in Gold’s potential. It’s as if the market is whispering that brighter days may lie ahead for this precious metal.
The support level at 1936 holds significance as it indicates a level at which demand for Gold is strong. Traders view this level as a potential entry point for long positions, as it represents a favorable risk-reward ratio. The fact that Gold has found support at this level suggests that buyers are active in the market and willing to purchase Gold at these prices.
Drawing from this analysis, traders are eagerly anticipating a surge towards the next milestone at 2045. This target level holds the promise of potential profits for those who have taken up long positions. It’s like an inviting window of opportunity, beckoning traders to seize the moment. The anticipation of a price increase towards this target level is rooted in the belief that the current bullish momentum will persist, carrying Gold’s value to new heights. It’s as if traders can almost taste the sweetness of success, fueled by their optimism and unwavering faith in the market’s upward trajectory.
However, before reaching the target level at 2045, Gold will need to break through the initial resistance at 1981. Resistance levels act as barriers to further price advances and can potentially halt or reverse an upward trend. Therefore, traders should closely monitor the price action around the 1981 resistance level to assess the strength of the buying pressure.

A decisive break above the resistance level at 1981 would serve as a strong trade signal, confirming the potential for a bullish continuation. Traders can look for key indicators such as increased buying volume and positive market sentiment to provide further confirmation of the upward trend. These signals would suggest that market participants have enough confidence in Gold’s price to push it higher.
When delving into trade signals, it’s vital to take into account a multitude of factors that can sway the price of Gold. Economic data releases, like reports on inflation or announcements from central banks, hold the power to exert a significant influence on the value of this precious metal. Similarly, geopolitical events such as political tensions or economic crises have the ability to rattle market sentiment and impact the behavior of investors. Traders must stay in the loop regarding these factors, diligently staying informed and evaluating their potential impact on the ever-shifting movement of Gold’s price. It’s akin to navigating through a complex maze, where awareness and assessment of these external dynamics are the compass that guides traders towards making informed decisions.
To optimize trading decisions, incorporating technical indicators can provide additional insights. Moving averages, such as the 50-day or 200-day moving average, can help identify the overall trend and potential support and resistance levels. Oscillators, such as the Relative Strength Index (RSI), can indicate whether Gold is overbought or oversold, providing clues about potential reversals. Trend lines can help identify the trajectory of the price movement and potential breakouts.
However, it’s important to note that trade signals are not guaranteed outcomes. Market conditions can change rapidly, and unexpected events or news can significantly impact the price of Gold. Therefore, it’s advisable to conduct thorough research, stay updated with relevant information, and consider consulting with a financial professional before making any trading decisions.
In conclusion, as of 6/8/2023, the trade analysis suggests a potential bullish trade signal for Gold. The support level at 1936 indicates buyer interest, while the target level at 2045 presents a profit opportunity. Breaking through the resistance at 1981 would confirm the bullish trend. Traders should consider various factors and incorporate technical indicators to optimize their trading decisions and manage risk effectively.


One thought on “Trade Analysis and Trade Signal for Gold as of 6/8/2023:”